Runs & Executions
When a customer gets a wrong answer from Acme Support's agent, the first thing Asha (who built it) wants to know is: what exactly did the agent do? The Runs screen answers that — node by node, message by message, credit by credit — without leaving the builder.
Every time an agent starts — an inbound message, a webhook, a schedule, a manual test — Perfox records the run so you can replay it on the canvas, read it as a transcript, and see what it cost.
New to the builder? Start with Canvas Basics. This page covers what happens after a run fires.
How the screen is laid out
Open an agent (Build → Agents → your agent) and click Runs in the toolbar (next to Editor). The screen has three parts:
| Area | What it shows |
|---|---|
| Left | The list of recent runs, with a status filter and auto refresh. |
| Centre | The agent's canvas, read-only, coloured by how each node did in the selected run, with a bar of run details and actions on top. |
| Bottom | A resizable panel with Chat, Logs, Diagram, Tokens and Usage tabs. |
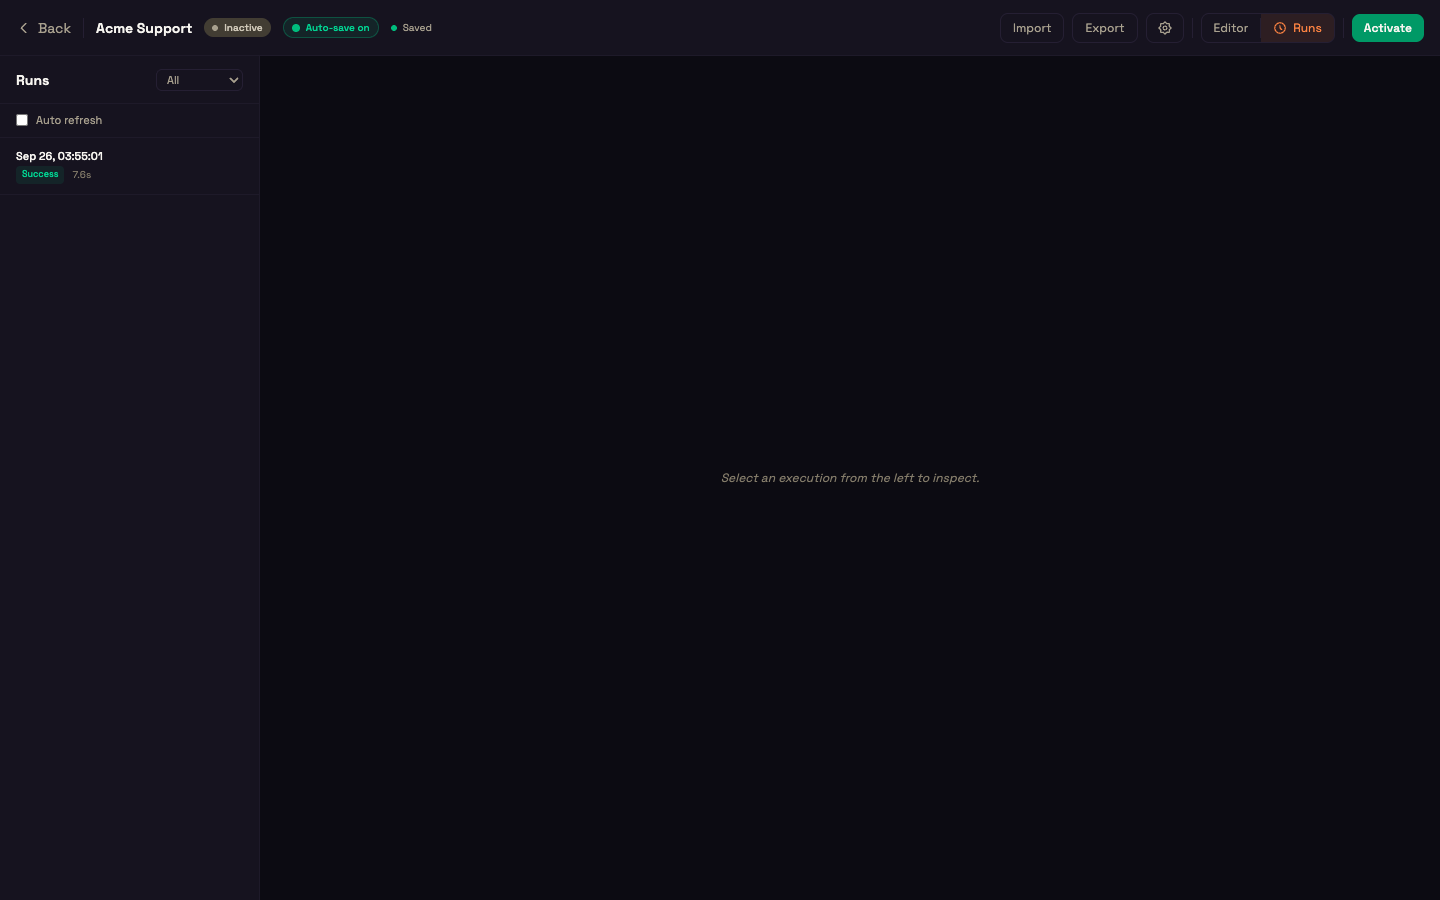
Each run has its own address, so you can bookmark a run or send a colleague a link that opens it directly. Click Editor to go back to building.
The runs list
Runs are listed newest first.
- Status filter — All, Pending, Success, Failed, Cancelled.
- Auto refresh — tick it to check for new runs every few seconds; your choice is remembered.
- Each row shows the start time, a status pill and how long the run took. A run that's still going shows a live, ticking timer instead. Rated runs show 👍 / 👎, and tags appear as chips.
- Load more — 50 runs at a time; the button shows how many of the total you've loaded.
- With no runs yet: "No runs yet. Run the workflow once to see history here."
The replayed canvas
Pick a run and the canvas shows the agent exactly as it is, read-only — you can select and inspect nodes, but not move or rewire them. Each node is coloured by what happened to it in this run:
| Node status | Colour |
|---|---|
| success | green |
| error | red |
| paused (waiting) | amber |
| skipped | grey |
Connections show how many items passed along them, and the path the run actually took is highlighted — so a run that branched lights up the branch it followed.
The run bar
Above the canvas, the selected run shows its start time, a status pill, the total duration (ticking while it's still running) and a short run ID (hover for the full id). Its actions:
| Action | What it does |
|---|---|
| 👍 / 👎 | Rate the run good or bad for QA (click again to clear). Ratings show in the runs list. |
| + Add tag | Add a free-text label (Enter to save). Tags appear as removable chips — up to 20 per run, 40 characters each. |
| Force end (live runs only) | After a confirmation, ends the run and hangs up any live voice call (the recording and billing are finalised). |
| Debug in editor | Jumps back to the editor with this run's data loaded as the trigger's sample input, and opens the first failed node (or the last node that ran). |
The bottom panel
Drag the top edge of the panel to make it taller or shorter — the height is remembered. ↗ Raw log (top-right) opens a plain-text log of the whole run in a new browser tab: every message, every tool call with its input, output and timing, and every node step, ready to save or share.
Runs that involved a conversation open on Chat. Webhook, schedule and manual runs have no transcript, so they open on Logs. A count on the right changes with the tab — steps, calls or messages.
Chat
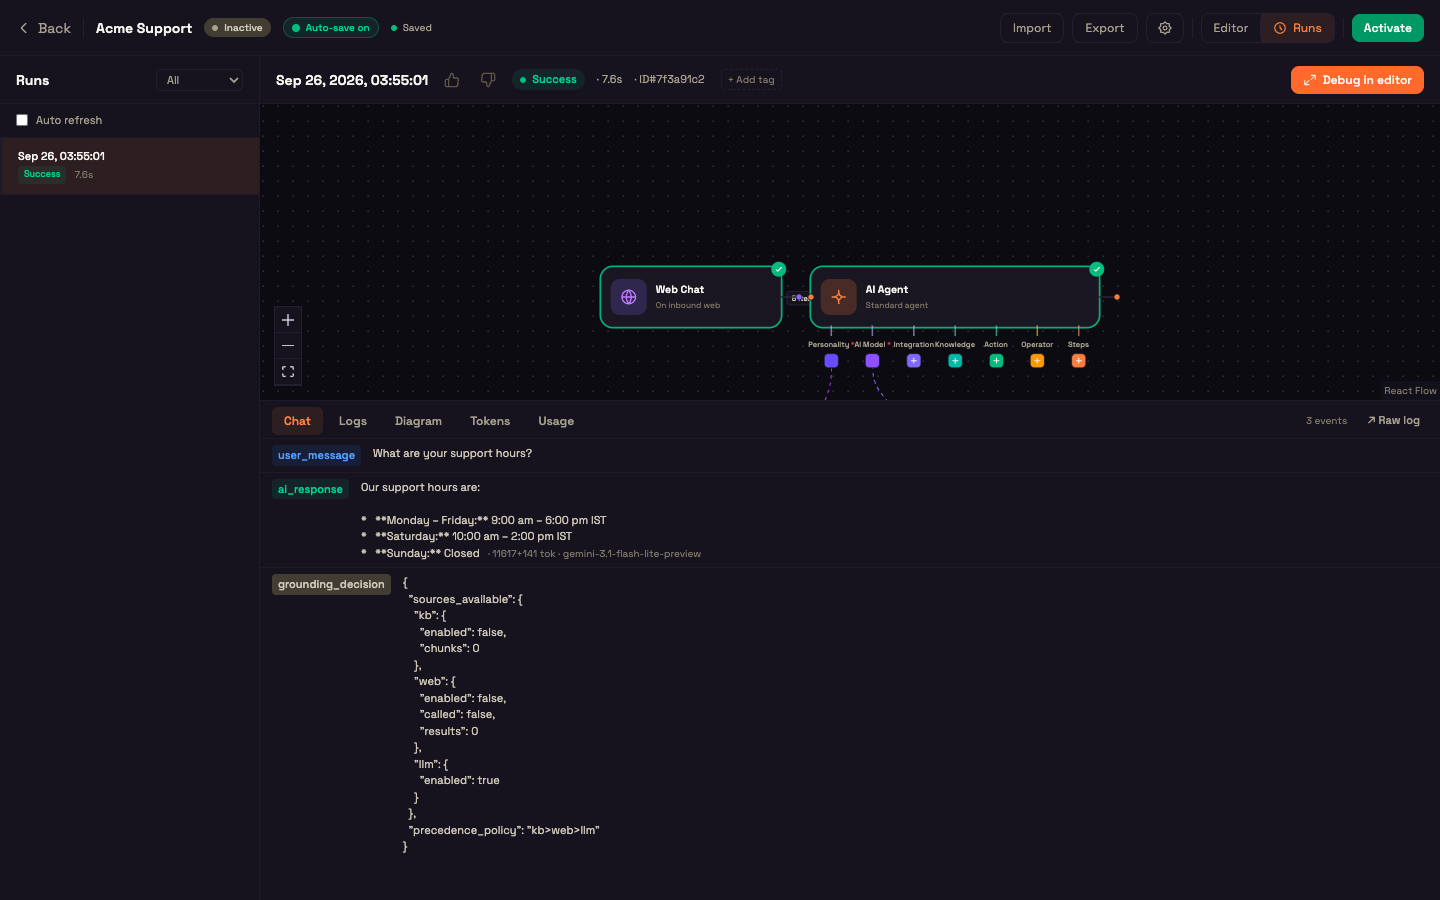
The conversation for this run only, as colour-coded rows: the customer's messages, the agent's replies (with the tokens used and the model), and each tool call with its timing and an expandable view of its input and output. A failed tool call is marked in red. Other recorded events — such as how the agent decided which knowledge sources to use — are shown as data so nothing is hidden.
Logs
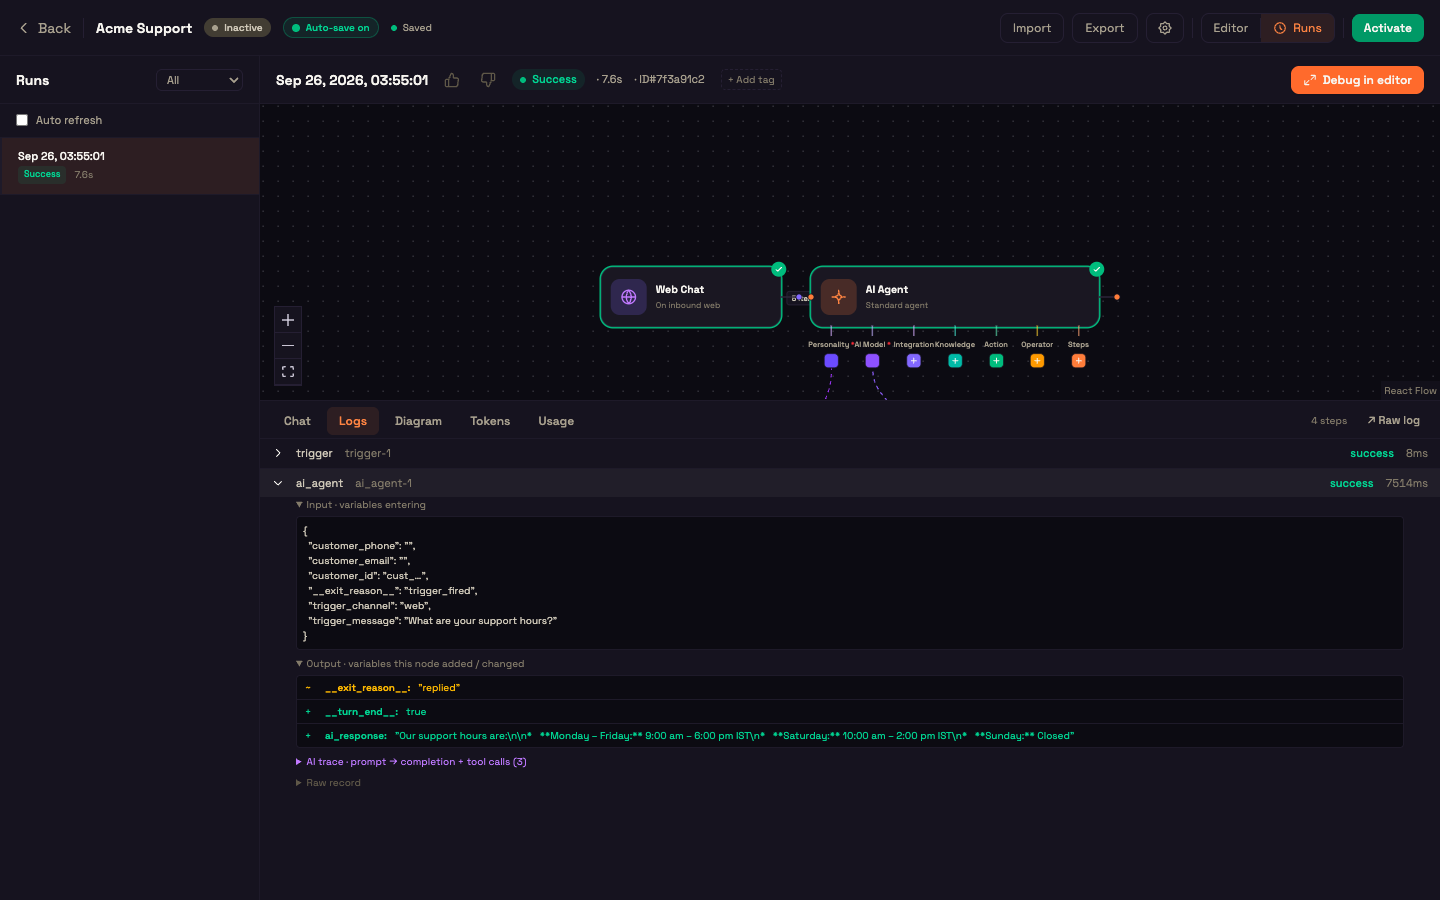
One row per node that ran, in order, with its status and time taken. Condition nodes show which branch was taken; a stage finishing shows a green Stage completed pill; a node the agent is waiting on shows open.
Expand a row to see:
- Input · variables entering — what the node received;
- Output · variables this node added / changed — what it produced, marked
+added,~changed or-removed; - AI trace (AI Agent nodes) — the prompt, the reply and every tool call for that turn;
- Raw record — the underlying data, for deep debugging;
- an error banner, if the node failed.
Diagram
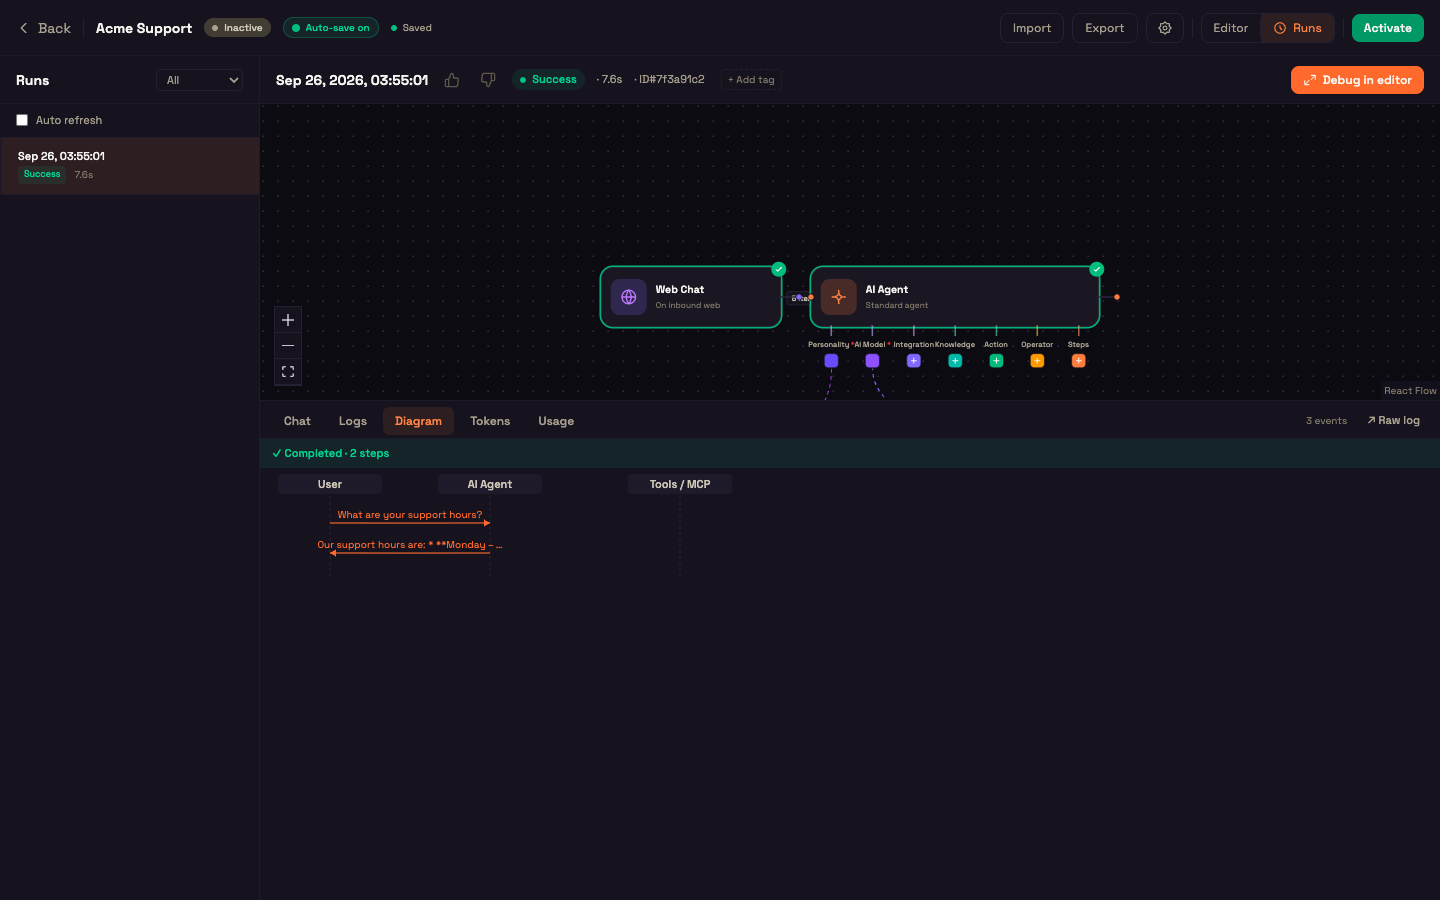
The run drawn as a sequence diagram with three lanes — User, AI Agent and Tools / MCP — and an arrow for every message, tool call and tool result (with timing). A banner on top says ✓ Completed · N steps, or ✗ Failed at step K with the tool and error — a one-glance picture of who called what, and where it broke.
Tokens
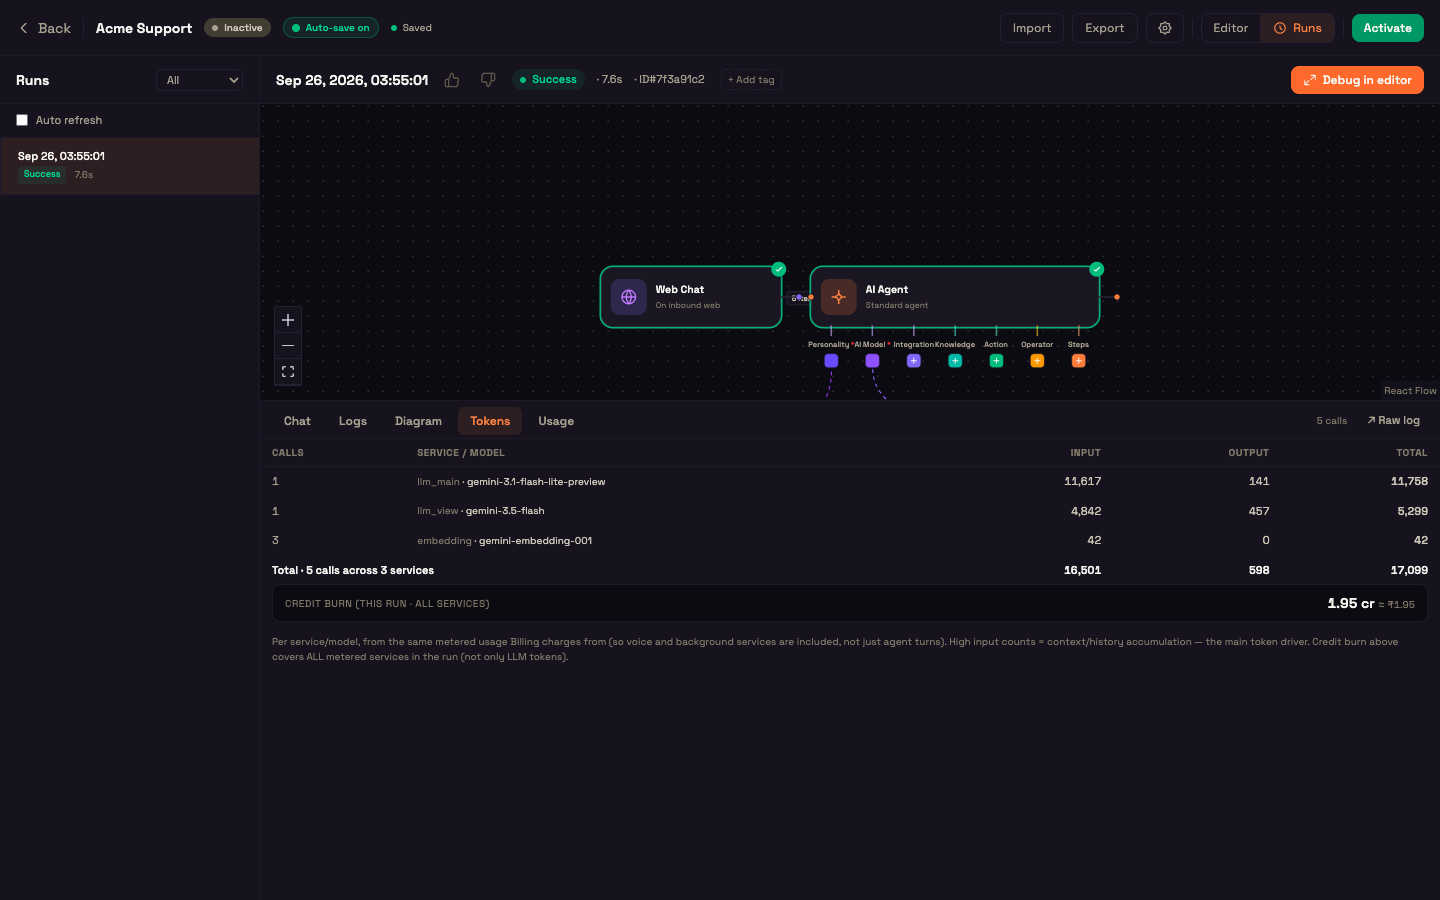
What the run used, per service and model, from the same metered usage your bill is calculated from — so voice and background services are included, not just the agent's replies.
| Column | Meaning |
|---|---|
| Calls | How many calls that service/model made. |
| Service / Model | The job (e.g. the agent's main reply, or a background check) and the model that did it. |
| Input | Tokens sent to the model. Large numbers usually mean a long conversation history. |
| Cached (green) | Shown only when some input was served from the model's cache at a much lower price — already included in Input. |
| Output | Tokens the model produced. |
| Total | Input + Output. |
A total row sums every column, and Credit burn (this run · all services) shows what the run cost, in credits and rupees.
Usage
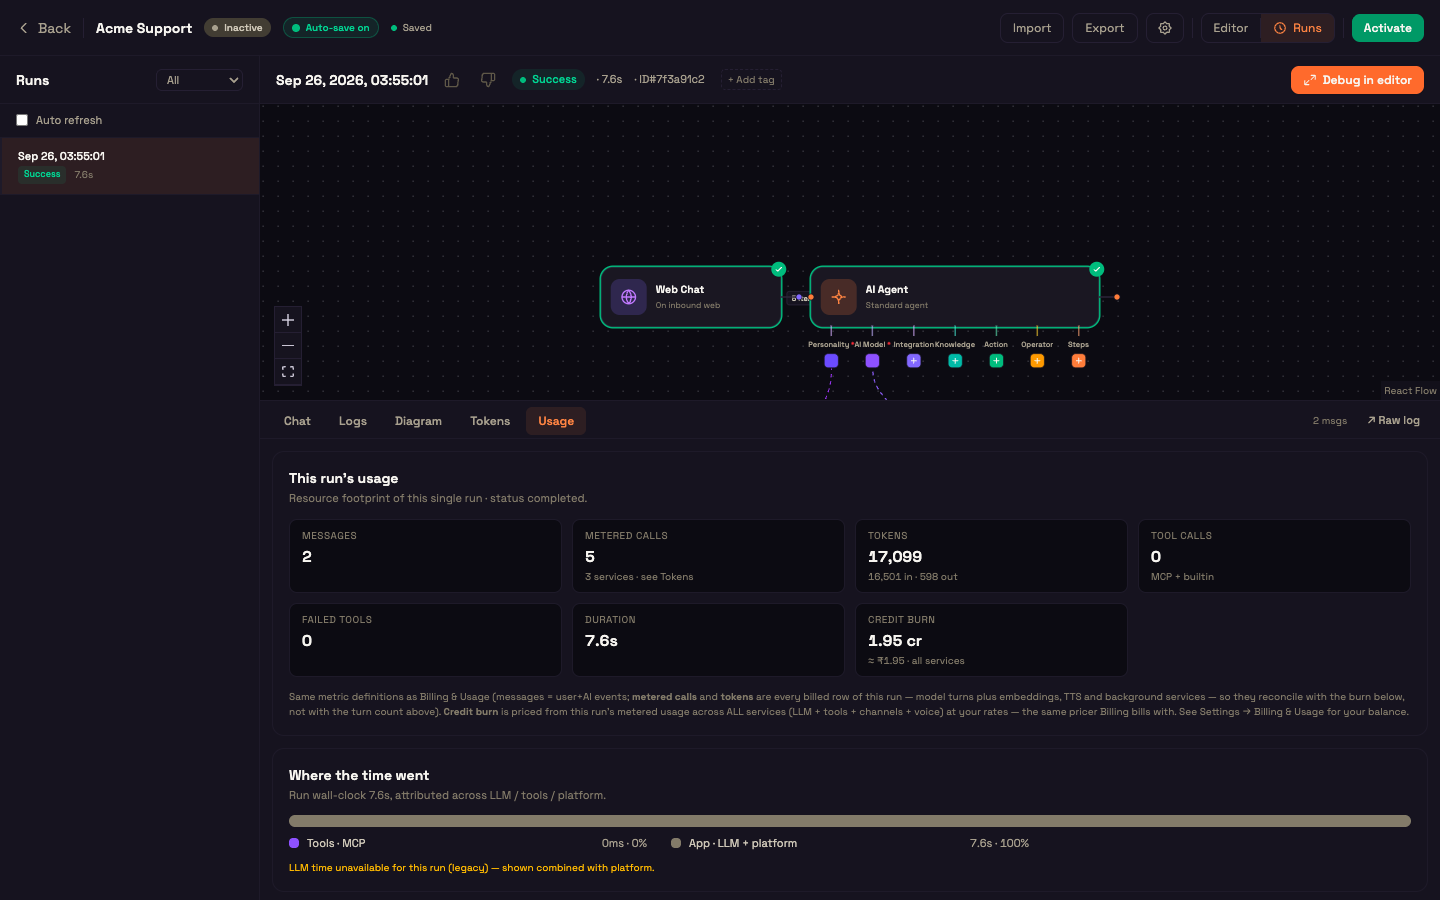
A billing-style summary of the single run.
| Tile | Meaning |
|---|---|
| Messages | Customer + agent messages. |
| Metered calls | Every billed call in the run, across services. |
| Tokens | Total tokens, split into in and out. |
| Tool calls | Integration and built-in tool calls. |
| Failed tools | Highlighted when above zero. |
| Duration | How long the run took. |
| Credit burn | What the run cost, in credits and rupees, across all services. |
Where the time went splits the run's time into LLM, Tools · MCP and Platform on a bar, and lists the slowest tools, so a slow run is blamed on the right thing. Older runs and voice calls that don't have per-turn model timing show a two-way split instead, with a note.
Run statuses
| Status | Meaning | Colour |
|---|---|---|
| Success | The run finished. An AI Agent that replied and ended its turn counts as success. | green |
| Failed | Something went wrong — open Logs or Diagram to see what. | red |
| Cancelled | The run was stopped (for example with Force end). | grey |
| Pending | Still running, or waiting — for a person, a reply, or a later step. | amber |
The same colours are used in the runs list, the run bar and on the Conversations page. One conversation can span several runs, so a customer's full history is on Conversations.
Worked example — debugging a failed run
Setup. Acme Diagnostics has an agent that looks up a patient's latest report and replies by email. Priya, a customer, wrote in and got no reply.
Action. Asha opens Runs, filters to Failed, and clicks the newest red row. The canvas lights up: the trigger is green and the AI Agent is red. In Diagram the banner reads "✗ Failed at step 4 — get_latest_report: connection timeout." She clicks Debug in editor; the builder opens with Priya's run data loaded and the failing part selected.
Result. The integration's address had a typo from the last edit. Asha fixes it, sends a test through, and follows up with Priya.
What just happened. The coloured canvas showed where the run went; the Diagram pinpointed the failing tool in one line; and Debug in editor let Asha reproduce the failure with the real data instead of guessing.
Common tasks
Find out why a run failed. Filter to Failed, open the run, read the Diagram banner or expand the red row in Logs, then click Debug in editor.
See what a run cost. Open Tokens for the breakdown and the credit burn, or Usage for the summary and where the time went.
Rate and tag runs for QA. Use 👍 / 👎 and + Add tag in the run bar; both show in the runs list.
Stop a stuck live run. Open it (it shows Pending and a ticking timer) and click Force end.
Share or archive a run. Click ↗ Raw log and save the page, or copy the run's address.
See also
- Canvas Basics — the builder and toolbar.
- The Properties Modal — the node panels you can open from a replayed run.
- Condition (IF/ELSE) — branches the replay highlights.
- Conversations — a customer's full history across runs.