Dashboard
The Dashboard is the first page you see after you sign in. In a few seconds it tells you how many conversations your agents have handled, which channels your customers are using, and what happened most recently. There's nothing to set up.
This page explains what each number means, where it comes from, and what to keep in mind when you read it.
Opening the Dashboard
Click Dashboard at the top of the sidebar. Every signed-in user can see it in the sidebar. To see the data, you need permission to read conversations (see Permission and error states).
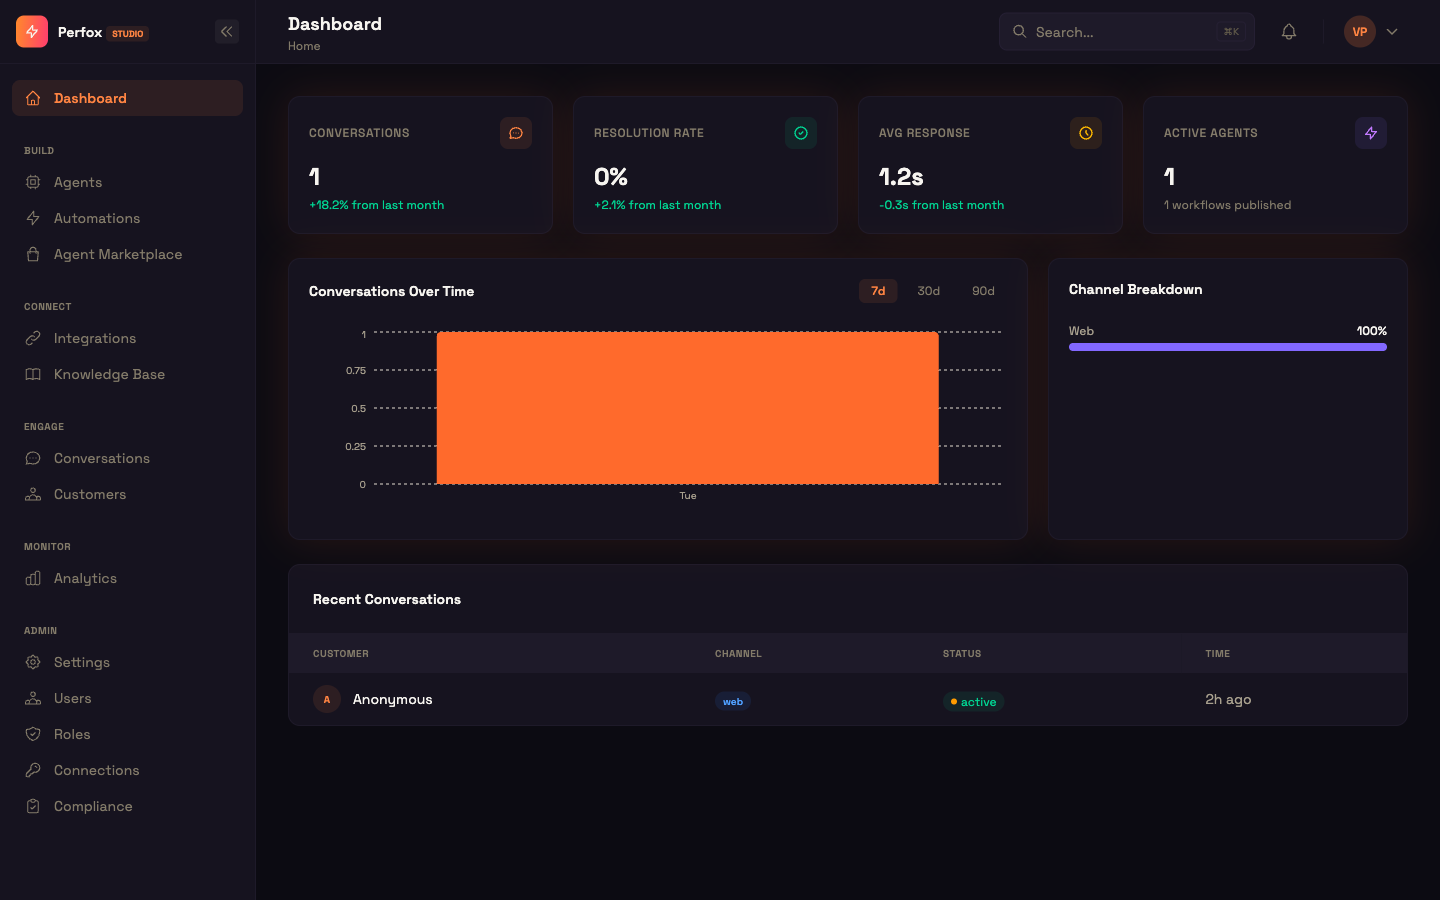
From top to bottom, the page has three parts:
- A row of four KPI cards.
- A charts row: Conversations Over Time on the left and Channel Breakdown on the right.
- A Recent Conversations table.
Where the numbers come from
When the page opens, it loads your 100 most recent conversations and your first 10 agents. It builds the charts and the table from that data. The Conversations card is the exception: it shows the true total for your whole workspace. For full-history, time-ranged reporting, use Analytics.
KPI cards
| Card | What it shows |
|---|---|
| Conversations | The total number of conversations in your workspace. |
| Resolution Rate | Resolved conversations as a percentage. It counts the resolved conversations among your 100 most recent ones. |
| Avg Response | Always 1.2s. This is a fixed display value, not a live measurement. |
| Active Agents | The number of agents loaded (up to 10). The caption underneath reads "N workflows published", where N is how many of those agents are published. |
The "… from last month" lines under the first three cards are also fixed text, not live comparisons.
Read these two cards with care
Resolution Rate is based on your most recent conversations only, so it is not a whole-history resolution rate. Avg Response is not measured at all. For real resolution and response-time figures over a date range you choose, use the Overview and Engagement tabs in Analytics.
Conversations Over Time
This bar chart shows how many conversations started on each day. It uses your most recent conversations and shows up to the last 7 days that had activity. Each bar is labelled with a short weekday name (for example Tue). Hover over a bar to see its exact count. With no data, the panel says "No data available".
The header has 7d, 30d and 90d buttons, but they don't change the chart yet: it always shows the same window. To compare longer periods, use Analytics, whose range buttons really do change every chart.
Channel Breakdown
Channel Breakdown shows the share of your recent conversations by the channel each one started on, for example Web, Phone, WhatsApp, Email or SMS. Each channel gets a labelled progress bar with its percentage, and the busiest channel is listed first. A conversation with no recorded channel is counted as Web. With no data, the panel says "No data available".
Recent Conversations
The table lists your five most recent conversations:
| Column | What it shows |
|---|---|
| Customer | An initials avatar and the customer's name. A conversation with no captured name shows Anonymous or a shortened ID. |
| Channel | A badge for the channel the conversation started on. |
| Status | The conversation status, such as active, resolved, escalated or abandoned, with a coloured dot. |
| Time | How long ago it started: just now, 5m ago, 3h ago, 2d ago. |
With no conversations yet, the table says "No conversations yet". On a phone, the same five rows appear as stacked cards.
To open or work on a conversation, go to Conversations.
Permission and error states
- Loading: a spinner appears while your conversations load.
- Insufficient permissions: if your role can't read conversations, you'll see an "Insufficient permissions" panel instead of data. It names the missing
conversations:readpermission. Ask a workspace admin to grant it under Roles. - Other errors: any other failure shows an error panel with the message.
What's next
- Analytics: five tabs of reporting over 24 hours, 7, 30 or 90 days, covering volume, resolution, response time, tools, tokens and system health.
- Conversations: the full list behind the Dashboard's numbers.